
A single AI answer that names your brand is the weakest number you can bring to a budget review. It looks like proof. Teams screenshot it, report it as a content win, and move on before anyone checks whether it comes back the next day.
This article is for B2B content and SEO leads who defend a budget line by line. You're choosing between publishing more, refreshing what exists and earning coverage on other sites. If you pay for an AI visibility platform, or you're about to, one feature decides whether its numbers survive a CFO's questions. It's how the platform samples. ChatGPT, Perplexity, Gemini and Google's AI Overviews give different answers to the same question from one run to the next.
So here's the argument. Treat AI visibility as a rate you estimate from repeated tests of fixed buyer prompts, across surfaces and across weeks. Decide nothing from a snapshot. A tool that reports single runs is handing you anecdotes with decimal points.
Why is one favourable AI answer not a result?
One favourable answer is a single draw from a system built to vary. It proves your brand can appear. That's all. It can't tell you how often you appear, on which surface, or whether your content caused it. A content decision needs a rate built from many runs, and one citation is a sample of one.
Think about what happened inside that one answer. The model may or may not have searched the web. If it did, it pulled a set of candidate pages, picked a few and wrote around them. Ask the same question an hour later and each of those steps can land differently. You saw one outcome out of many it could have produced.
The trap gets worse when the win follows a change. You refresh a page on Monday and spot a citation on Thursday, and the story writes itself. Prompts you never touched may have moved that same week, up or down, for reasons unrelated to your edit. Without them in view, you're giving the refresh credit for the weather.
Now picture the conversation with finance. “ChatGPT mentioned us” is a story. “We were mentioned in this share of runs, across these prompts, on these surfaces, over these four weeks, and here's how sure we are” is a number someone can put in a cell and defend when the CFO pushes back. Only the second version tells you whether to fund the next round of refreshes.
Your measurement tool has to make that sample visible, across prompts, surfaces and dates. If it can't show you the denominator, its readout is a snapshot dressed as a trend.
Is answer churn a flaw or how these systems work?
Churn is how these systems work. A peer-reviewed study found the sources behind Google's AI Overviews turn over far faster than its organic results. In a separate repeated-query study, models were still naming brands they hadn't named before after fifteen runs. So stop waiting for answers to settle. Build a measurement method that expects variation and samples enough to see through it.
A peer-reviewed study in this year's Findings of ACL reran the same queries two months apart. Only 18% of the pages behind Google's AI Overviews appeared both times, against 45% of Google's organic results [1]. Fewer than one in five AI Overview sources survived the gap. Nearly half the blue links did.
The same work holds a more awkward result for anyone reporting yes-or-no outcomes. Repeated runs reversed the answer's decision in 9% to 28% of cases across the systems and time gaps tested, even with randomness set to zero where the systems allowed it [1]. That range counts flipped decisions, which is a separate measure from changed citations. It still tells you the conclusion of an answer can move between identical runs.
The second study asked 50 questions 15 times each across six engines. For the five engines answering without web retrieval, 86% to 92% of question and engine pairs were still producing an organisation never seen before on the fifteenth run [2]. Fifteen tries weren't enough to map the full set of brands those models might recommend.
Language models produce each answer by sampling from many possible continuations, and retrieval adds a second source of variation as the pool of web pages shifts from week to week. Neither source is going away. So design your measurement around that variation. The systems won't remove it for you.
What is your AI visibility platform score hiding?
One visibility score can hide how many times each question ran, whether live search was on, and what it counted. Mentions, cited URLs and visits are separate events. Blend them and your brand can look steady while the pages supplying the evidence change underneath. Your own site may have stopped doing the work, and the score won't tell you.
Start with the denominator. A 26% score built from 20 runs and a 26% score built from 500 runs carry very different confidence. Profound's published customer story for Airbyte reports ChatGPT visibility rising from 9% to 26% in one week, plus a separately dated overall score climbing from 18.9% to 47.1% over ten weeks in the spring of 2025 [3]. That's nearly a threefold jump in seven days. The gains may well be real, but the account doesn't give the prompt count or runs per prompt behind each percentage, so nobody outside the team can weigh them against normal churn.
The denominator is only the first layer. Ask where the prompts came from, because a panel generated from a keyword list measures something different from one built out of sales calls. Find out whether some prompts or surfaces carry more weight, what happens to failed or empty runs, and whether answers come from the consumer app or an API. If you can't rebuild the score from prompt-level records, you can't compare it with another vendor's number.
Next, ask whether search ran. OpenAI runs separate crawlers for search answers and for possible model training, OAI-SearchBot and GPTBot, and treats them as independent choices for site owners [4]. A brand mention with no cited source may reflect what a model absorbed during training. A cited URL came from a search that ran during that session. A refresh can reach the second pathway quickly, while the first is slower and harder to trace, so a score that mixes them muddies any before-and-after comparison.
Then look past the brand to the page. In the repeated-query study, retrieval-enabled Perplexity cells settled on a fairly small set of brands, a median of eight, yet their cited domains were still growing in 44% of cells at the fifteenth run [2]. A stable brand list can sit on top of an unstable source list. Your name can keep appearing while the citation behind it drifts from your product page to a review site or a competitor's comparison post.
Finally, treat each surface as its own system. Google's AI Overviews draw on pages indexed and eligible for a normal search snippet. ChatGPT and Perplexity document their own search crawlers. Gemini and Claude cite live sources only when grounding or web search is switched on. Track mention, cited URL and visit as three separate outcomes, per surface, so you can see where you're winning and where you're invisible.
How do you build a prompt panel buyers would ask?
Pick a fixed panel of high-intent commercial questions your buyers ask before they have a shortlist, on the AI surfaces they use. Leave branded prompts out. Run identical baseline wording every cycle alongside a few natural variants, in fresh, independent sessions with search set the way a real buyer would have it.
Branded prompts are the easiest way to flatter a dashboard. Ask a model what your company does and it will often have an answer. That measures whether the model knows you exist. A buyer still forming a shortlist often doesn't know your name yet, so the prompts that matter describe a problem, a category or a comparison.
For a security software company, that means prompts like “cloud detection tools for a team without a 24/7 SOC”, “alternatives to [competitor] for mid-market companies” and “how to compare managed detection providers”. Pull them from sales call notes, lost-deal reasons and the questions prospects raise in demos. Group the candidates by buyer task, such as shortlisting, replacing a tool or comparing providers, and pick a few from each group so no single task dominates. Write the list down. Then freeze it.
Single Point of Contact, which sells white-label IT, help desk and security operations services to managed service providers, offers one documented example of a fixed panel. Its agency tracked 64 prompts, reviewed results daily in-house and walked through them with the client each month [5]. Fernando Leon, its vice president of sales and marketing, put the starting point this way. “We were doing well with SEO, and we weren't about to walk away from that.”
Keep a baseline set of identical wording that never changes, so week ten compares cleanly with week one. Add natural variants beside it, because buyers phrase the same need in different ways. Report the two sets separately. When a new question earns a place, add it as a dated panel version and keep the original set running. Retire prompts the same way, on the record.
Then match how buyers search. Use fresh, logged-out sessions so earlier chats and personalisation don't leak into results, which mirrors the independent, logged-out runs in the Findings of ACL study [1]. Record whether web search ran on every response. Pick the two to four surfaces your buyers use, based on referral data and what sales hears, and skip engines a vendor covers just because it can.
How do you tell normal churn from a real gain?
Sample the same panel across successive weeks, report each rate with its uncertainty, and compare prompts tied to pages you changed against prompts tied to similar pages you left alone. Call it a gain only when the changed group pulls clear of the unchanged group and stays there. Agree that rule before the test runs.
Most dashboards go quiet on uncertainty, so do the sums yourself. Say your brand appears in 6 of 20 runs. That's a 30% mention rate, but a standard binomial interval puts the plausible range at roughly 15% to 52%. At 30 of 100 runs, the range tightens to about 22% to 40%. A jump from 30% to 40% on 20 runs sits comfortably inside the noise.
Intervals alone won't catch a market-wide shift. A model update, a competitor's launch or a news cycle can lift or sink every prompt in your category at once. So tag prompts that map to the pages you refreshed and prompts that map to similar pages you didn't touch. If both groups rise together, the market moved. Only the gap between them is yours to claim.
Write the decision rule down before the first run, and fix the sampling with it. One illustrative plan runs each prompt five times per surface every week and pools those runs across each group, so ten prompts give 50 runs per surface. The rule then reads like this. We'll call a refresh a success if the changed group's pooled citation rate stays above the unchanged group's, with intervals that don't overlap, for four consecutive weekly samples on at least two surfaces.
That rule is a judgement for acting under uncertainty, and no published work I've seen validates a specific number of weeks or runs. Say so in the planning doc. Even a clean pass shows that the changed pages pulled ahead, which is weaker than proving why. A scoped test with a stated stopping rule is still easier to defend to a CFO than a promised uplift, because it tells them in advance what result would change your mind.
Do more daily scans make an AI visibility platform reliable?
Frequent scans and wide engine coverage add data. They add confidence only when the prompt panel reflects real buyers, capture conditions stay fixed and the decision rules exist before results arrive. Daily runs of a weak panel give you a very precise measure of the wrong thing.
So doesn't more data help? Up to a point, yes. More samples do shrink your intervals, and the move from 20 runs to 100 shows how much. If the extra runs are independent draws on questions buyers ask, more is better.
Repetition only helps when the right thing gets repeated. Daily scans of branded prompts, in sessions that sometimes search and sometimes don't, copy the same flaw every day. Broad engine coverage adds surfaces your buyers may never use and averages them into one score. You end up with thousands of rows and no answer to the question your CFO asked.
The customer stories in this category show the gap. Airbyte's and Single Point of Contact's published accounts both describe sizeable monitoring programmes, yet neither sets out run counts per prompt, session conditions or an unchanged comparison group that would let an outsider separate a content effect from churn. That's a gap in what was published, and the reported gains may still hold.
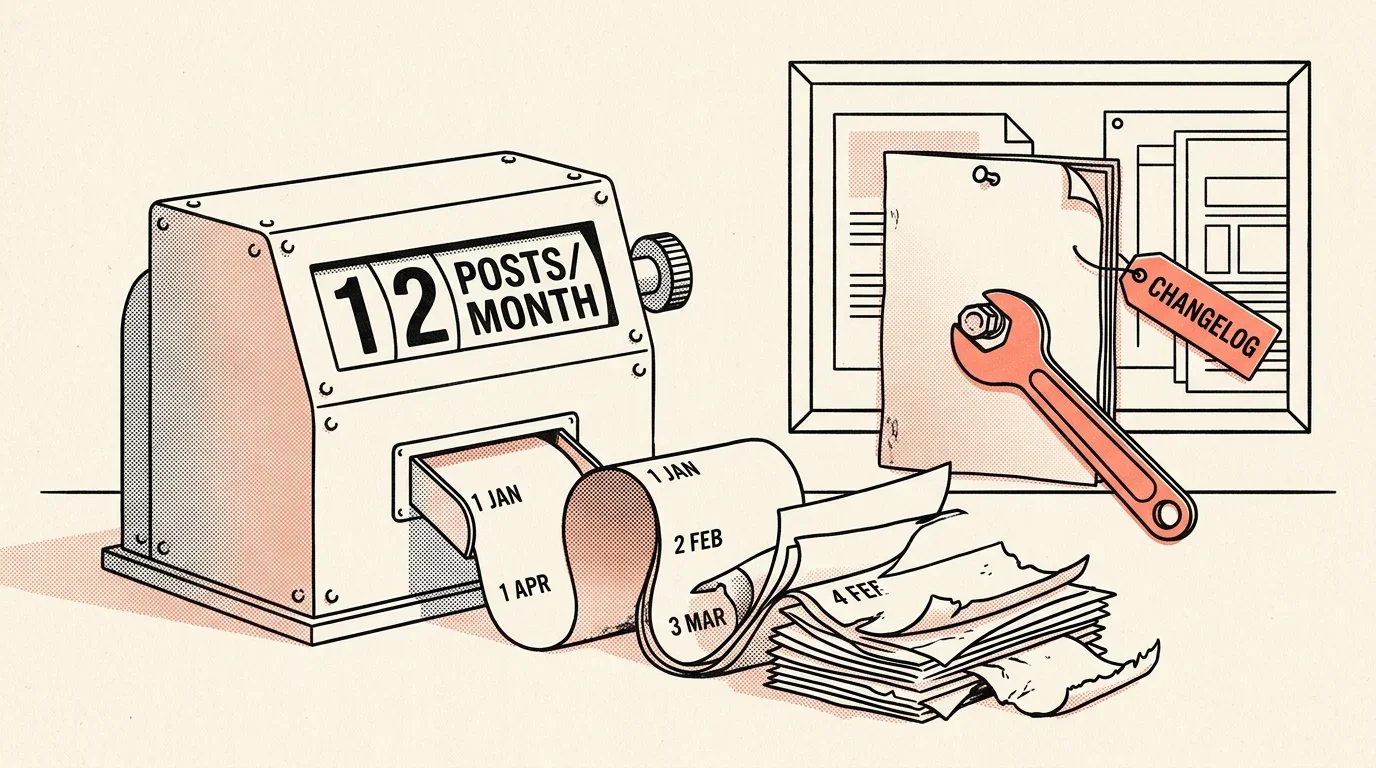
The same logic applies to publishing volume. If your team publishes a dozen posts a month and visibility for your core categories hasn't moved, a thirteenth post won't tell you why. Each new post adds another unmeasured variable. I'm not aware of a controlled test showing that a weekly cadence beats one strong page kept up to date, and until you know whether existing content earns citations, more output buries the signal you need.
What should a sampled result tell you to do next?
Let a sustained pattern pick the action. Your options are a substantive refresh, a new page for a distinct question or credible third-party coverage, and the table below sets out which pattern points to which. Then check whether visits, qualified pipeline and shortlist entry follow.
Refreshes have a plausible case. In one study of cited pages from ChatGPT, Gemini and Perplexity answers this spring, 75% of the datable pages had been updated within the past year, and among pages with both dates, 72% were recently updated while only 42% were newly published, a 30-point gap [6]. The limit is selection. That sample only covered pages already being cited, so it can't measure the lift an update causes. A new page earns its place when your panel shows a distinct buyer question that nothing on your site answers.
Third-party coverage has the closest thing to a comparison. In March, a study of 87 stories from 30 brands reported that 97% of stories distributed through a publisher network earned at least one AI citation, against 82% of owned versions, a 15-point gap [7]. Across 75,000 brands, branded web mentions correlated with AI Overview visibility at 0.664, roughly three times the 0.218 for backlinks [8]. Both are associations. Prominent brands may simply collect more mentions and more citations at the same time.
| Option | Sampled pattern that justifies it | How to measure it | How strong the case is |
|---|---|---|---|
| Substantive refresh | Your page is cited on key prompts, but its citation rate slips across several weeks | Citation rate for that exact URL against similar unchanged pages | Plausible. Cited pages skew recently updated, but that sample can't show cause |
| New page | A recurring buyer question where no page of yours is ever cited | Mention and citation rate on those prompts before and after the page goes live | Reasonable when the question is distinct. Cadence itself is untested |
| Third-party coverage | Publisher or competitor domains hold most citations on prompts where you're absent | Mentions and cited third-party URLs, then referral visits and qualified pipeline | Associative. Observational comparisons and correlations, no randomised test |
Visibility is a leading indicator. You'll find the business case further down, in referral visits, qualified opportunities and whether you made the buyer's first shortlist. Keep panel rates, AI referral visits from analytics and CRM-matched opportunities on separate lines, and leave a citation with no matching visit as a visibility number. Single Point of Contact's agency reported mentions growing more than fivefold and citations about 5.4 times between April and June, alongside a 30% rise in inbound leads [5]. Those figures come without a control group, but they're reported as separate lines, and that habit is worth copying.
Before you trust any platform's readout, put these questions to it:
- How many times does each prompt run per cycle, and can I see that count?
- Was web search on for each response, and is that recorded?
- Does it store the exact cited URL, separate from the brand mention?
- Can I export prompt-level history by surface and date?
- Can I tag changed and unchanged pages as comparison groups?
- Does it connect citations to referral visits and pipeline in my analytics?
Hold any AI visibility platform to that list, ours included. Start small. Freeze a panel now, run it weekly for four weeks before you change anything, and write the stopping rule into your measurement plan before the first refresh goes live. Eclipse runs GEO profiles weekly against the buyer queries, competitors and platforms you define, and gives each engine its own scorecard with total queries beside citation rate and mentions, so the denominator stays in view on every surface. If you'd like to see that set up for your own category, get in touch and we'll walk you through it.
Our Opinion
The measurement plan has to start at the planning stage, before the dashboard. A changed-versus-unchanged comparison only works if every page is mapped to the panel prompts it's meant to win before anyone touches it. A page with no mapped prompts can't sit in the changed group or the unchanged group, so it adds nothing to the test. Rebuild that mapping after a citation appears and you're back to giving a refresh credit for the weather. So we tie each asset to a defined GTM job and a named set of buyer prompts before work begins.
The market still gets one thing wrong. Teams treat AI visibility as a reporting purchase. Buy a score on its own and the prompt panel, the page mapping and the decision rule end up scattered across spreadsheets, chat threads and people's heads, where they vanish at the next handover. That's where the evidence trail breaks. Our position is blunt. When AI visibility is the reason for a line in next quarter's content budget, whether a new post, a refresh or earned coverage, that line should name the prompt group it's expected to move and the stopping rule that would end it. If it can't, don't commission it.
About the Author
Mark Ridgeon is the founder of Eclipse, the B2B content operating system for scaling companies. He writes about evidence-led go-to-market content, client-scoped workflows and keeping every claim tied to proof from research through to publish. He also does fractional COO work through ridgeon.me, a vantage point that puts budget scrutiny right beside content strategy, which is where most content leaders now sit.
References
- Characterizing Web Search in the Age of Generative AI. Findings of ACL, 2026.
- Sampling Completeness in Generative Search: Brand and Cited-Domain Accumulation under Repeated Queries. arXiv.
- Airbyte customer story. Profound.
- Overview of OpenAI Crawlers. OpenAI.
- NOLA Marketing in Action: Single Point of Contact. NOLA Marketing.
- Study: Content Recency's Impact on AI Visibility in 2026. Seer Interactive.
- New Stacker Research: Earned Media Distribution Triples AI. GlobeNewswire.
- An Analysis of AI Overview Brand Visibility Factors (75K Brands Studied). Ahrefs.